Reading your numbers: revenue, traffic and email
The four places to read your numbers — business, traffic, email performance and the mail log — what each answers and which number actually matters.
There are four places to read numbers in the dashboard, each answering a different question. Working out which one answers your question beats staring at all of them.
| What you want to know | Where to look |
|---|---|
| How much did I make, and which course sells | Overview → Analytics → Business |
| How many people came, and from where | Analytics → Traffic |
| Is anyone reading my emails | Marketing → Email performance |
| Did that one email actually go out | Marketing → Mail log |
Business numbers
Overview → Analytics opens here. Top right switches between the last 7 / 30 / 90 days.
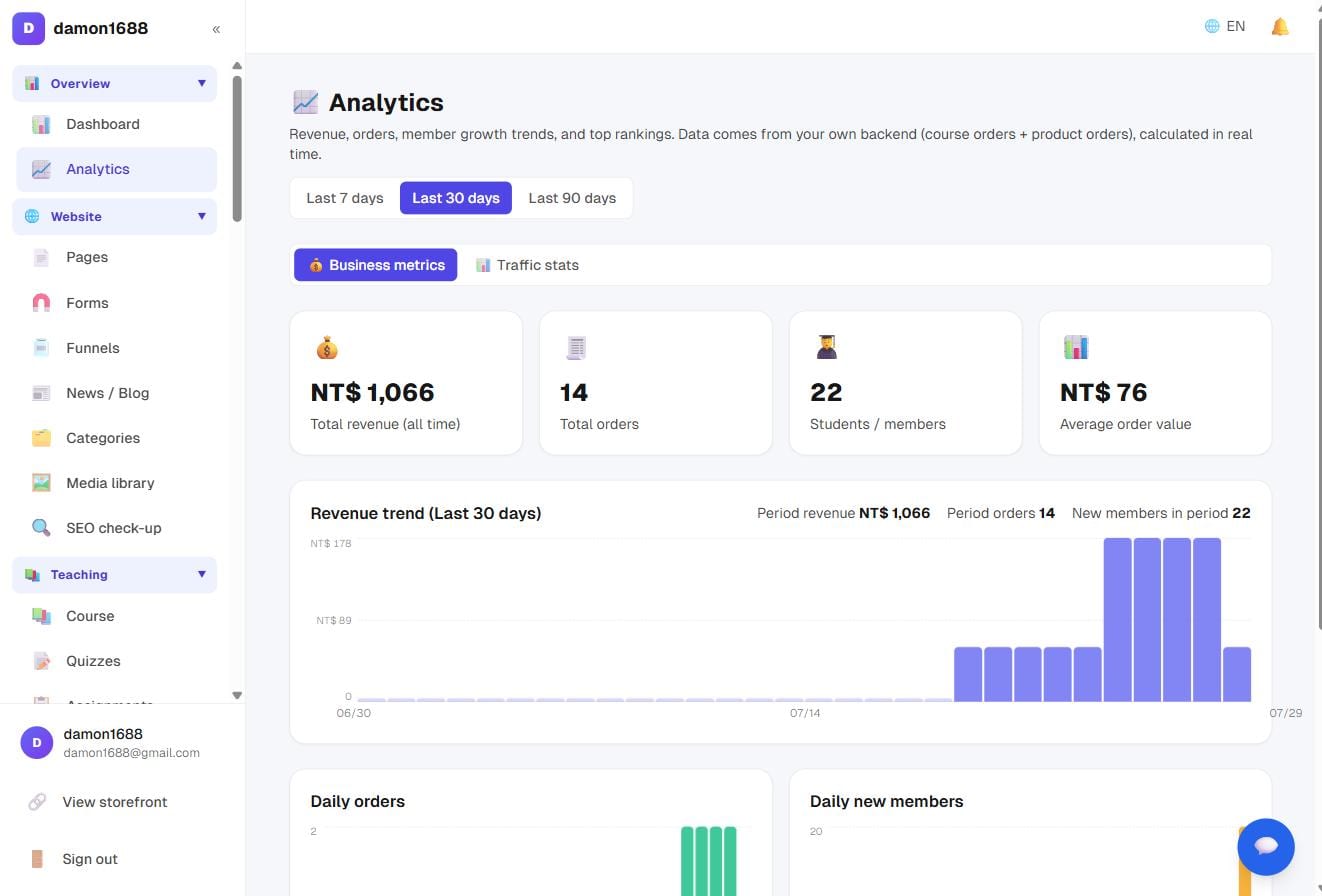
The four tiles on top are all-time totals (revenue, orders, students, average order value) and ignore the date range — they answer "how is this site doing overall".
The three figures beside the revenue chart are the range numbers (revenue, orders, new members) and do follow your selection.
Three leaderboards below:
- Top courses by revenue — not by units. Selling a lot isn't the same as earning a lot
- Top products by revenue
- Top posts by views — which content is actually bringing people in
Everything is computed live from your own orders, not refreshed overnight.
The number to look at first
Average order value. It's the easiest to move and the most often ignored: add a premium tier, bundle two things, or drop the cheapest option and it changes — without needing a single extra visitor.
Traffic
Switch to the 📊 Traffic tab on the same page. This is a lightweight self-hosted counter: no Google Analytics, no cookies, which also means ad blockers don't remove it. Expect numbers slightly higher than GA — GA is the one under-counting.
You get visitors, page views, top pages, referrers and devices.
For proper marketing attribution (which ad produced which sale), that's GA4 / Meta Pixel territory → Tracking codes and the SEO check.
Email performance
Marketing → Email performance: sends, opens and clicks for sequences and newsletters.
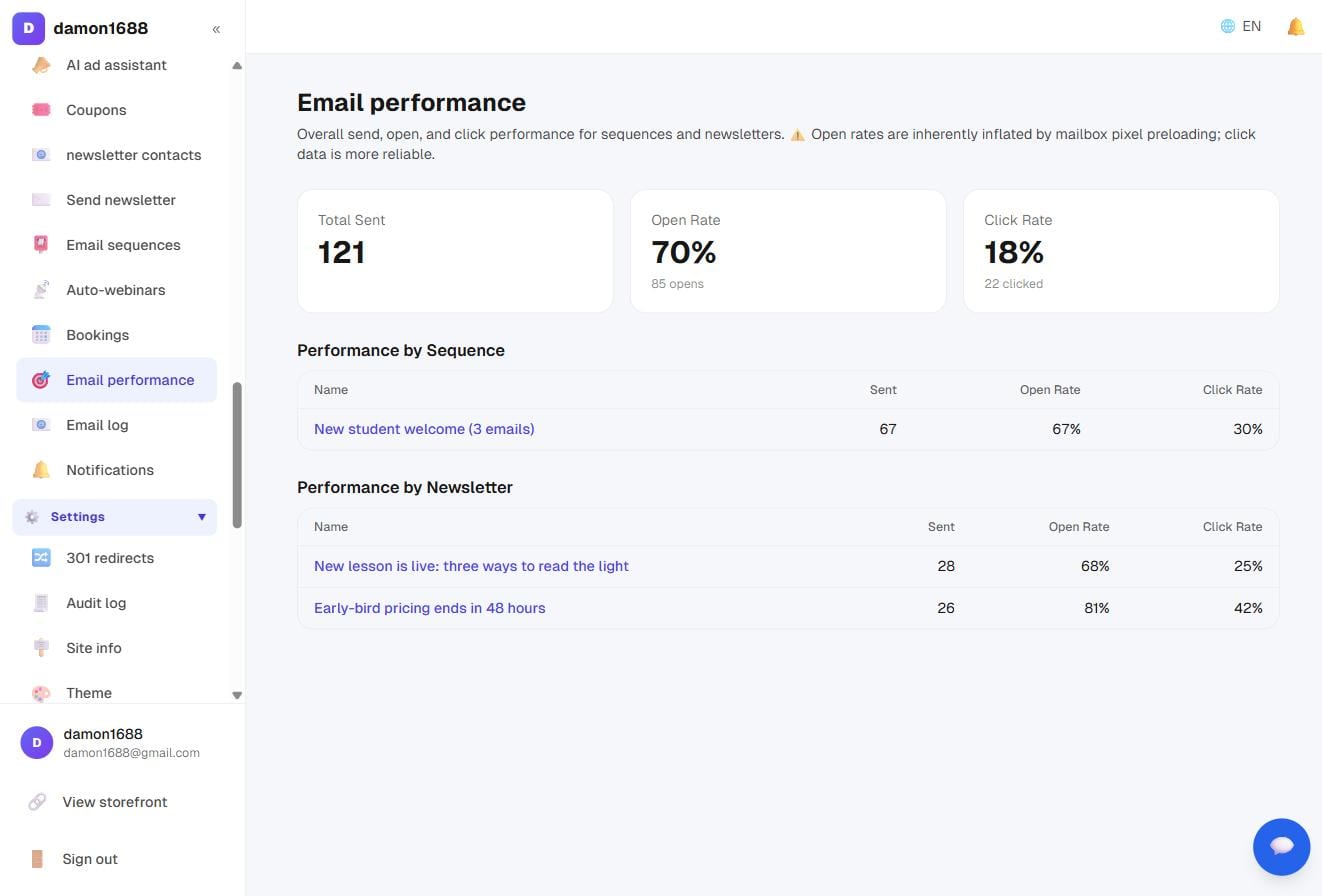
The three KPIs on top are site-wide totals; below them, one table for sequences and one for newsletters. Click a name to jump straight to that email.
⚠️ Open rates run high by nature — don't make decisions on them. Modern mail clients (Apple Mail especially) pre-load images on the recipient's behalf, which registers as an open even though nobody looked. Click rate is the trustworthy one — that took a deliberate action.
How to read it:
- High opens, low clicks → the subject line works, but the body gives no reason to act
- Low opens → a subject-line problem, or a list that's gone cold
- Both low → first check the mail actually got delivered (next section)
Mail log
Marketing → Mail log is the ledger of every email the system sent: notifications, order receipts, newsletters.
- Filter by status (delivered / failed), date range, recipient or subject
- View content shows exactly what was sent at the time
- Resend re-delivers it — this is the answer to "I never got my receipt"
- Set a retention period; older records are cleared automatically
When a student says an email never arrived: look for the record here first. Record exists and succeeded → ask them to check spam. No record at all → the problem is the trigger, not the sending. Status failed → read the error; usually a typo in the address or mail setup that isn't finished.
FAQ
Why don't the traffic numbers match Google Analytics? They won't. Ad blockers remove a slice of GA's data; the self-hosted counter isn't affected. Compare trends, not absolute values.
Does revenue include refunds? Refunded orders are excluded. Change an order's status and the figures follow immediately.
Can I export a report? The order list exports. The analytics page is for trends — pull line items from orders.
Do I need a cookie banner for the traffic stats? Not for these — no cookies, no personal tracking. If you add GA4 or Meta Pixel, those are a different matter.